


Acta Veterinaria et Zootechnica Sinica ›› 2025, Vol. 56 ›› Issue (3): 1170-1179.doi: 10.11843/j.issn.0366-6964.2025.03.018
• Animal Genetics and Breeding • Previous Articles Next Articles
WANG Haoyu( ), MA Keyan, LI Taotao, LI Dengpan, ZHAO Qing, MA Youji*()
Received:2024-09-18
Online:2025-03-23
Published:2025-04-02
Contact:
MA Youji
E-mail:1415600198@qq.com;yjma@gsau.edu.cn
CLC Number:
WANG Haoyu, MA Keyan, LI Taotao, LI Dengpan, ZHAO Qing, MA Youji. Population Genetic Diversity and Population Structure Analysis of Small-boned Goat Based on Specific-Locus Amplified Fragment Sequencing[J]. Acta Veterinaria et Zootechnica Sinica, 2025, 56(3): 1170-1179.
Table 1
Samples information"
| 群体Population | 地点Location | 样本量Sample size | 样本类型Sample type |
| 小骨山羊XG | 甘肃省兰州市 | 20 | 血液 |
| 河西绒山羊HXC | 甘肃省张掖市 | 20 | 血液 |
| 内蒙古绒山羊(阿尔巴斯型)IMC | 内蒙古自治区鄂尔多斯市 | 20 | 血液 |

Fig. 1
The distribution of SNPs on chromosome"

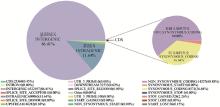
Fig. 2
Annotation distribution of SNPs in the genome"
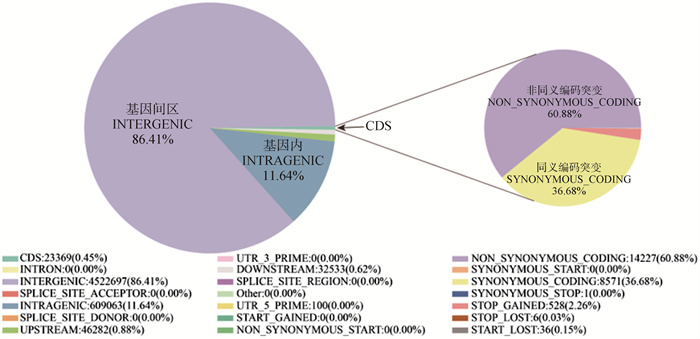
Table 2
Genetic diversity indexes of 3 goat populations"
| 群体 Population | 次要等位基因频率 MAF | 期望杂合度 He | 观察杂合度 Ho | 基因多样性指数 Nei | 多态信息含量 PIC | 香浓维纳指数 SHI |
| 河西绒山羊HXC | 0.210 | 0.297 | 0.206 | 0.306 | 0.243 | 0.460 |
| 内蒙古绒山羊(阿尔巴斯型)IMC | 0.213 | 0.299 | 0.209 | 0.308 | 0.244 | 0.462 |
| 小骨山羊XG | 0.216 | 0.302 | 0.197 | 0.312 | 0.247 | 0.466 |

Fig. 3
Linkage disequilibrium analysis"

Table 3
Pairwise Fst among 3 populations"
| 群体Population | 河西绒山羊HXC | 内蒙古绒山羊(阿尔巴斯型)IMC | 小骨山羊XG |
| 河西绒山羊HXC | 0.034 | 0.043 | |
| 内蒙古绒山羊(阿尔巴斯型)IMC | 0.052 | ||
| 小骨山羊XG |

Fig. 4
Population genetic structure analysis of 3 goat populations A. Principal component analysis; B. Evolutionary tree; C. Cross-validation error rates for different values of K; D. Population structure analysis"
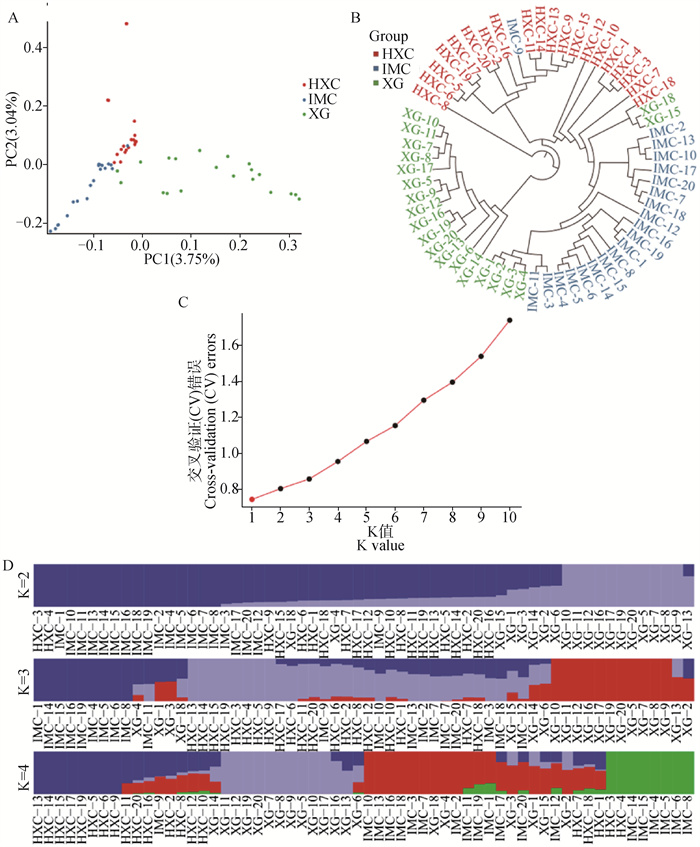
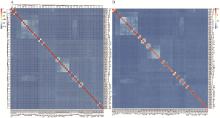
Fig. 5
Kinship analysis A. IBS distance matrix; B. Kinship G matrix"

| 1 | 王启贵,王海威,郭宗义,等.加强畜禽遗传资源保护推动我国畜牧种业发展[J].中国科学院院刊,2019,34(2):174-179. |
| WANGQ G,WANGH W,GUOZ Y,et al.Strengthening protection of livestock and poultry genetic resources, promoting development of animal breed industry in China[J].Bulletin of Chinese Academy of Sciences,2019,34(2):174-179. | |
| 2 |
NOTTERD R.The importance of genetic diversity in livestock populations of the future[J].J Anim Sci,1999,77(1):61-69.
doi: 10.2527/1999.77161x |
| 3 |
SUNX W,LIUD Y,ZHANGX F,et al.SLAF-seq: an efficient method of large-scale De Novo SNP discovery and genotyping using high-throughput sequencing[J].PloS One,2013,8(3):e58700.
doi: 10.1371/journal.pone.0058700 |
| 4 | 朱兰,孙利民,袁跃云,等.利用微卫星标记分析兰坪长毛山羊遗传多样性[J].草食家畜,2022,43(1):1-10. |
| ZHUL,SUNL M,YUANY Y,et al.Analysis on genetic diversity of Lanping long-haired goat population using microsatellite DNA marker[J].Grass-Feeding Livestock,2022,43(1):1-10. | |
| 5 |
KAWĘCKAA,PODBIELSKAA,MIKSZA-CYBULSKAA,et al.Genetic structure of reconstituted native Carpathian goat breed based on information from microsatellite markers[J].Ann Anim Sci,2022,22(4):1235-1244.
doi: 10.2478/aoas-2022-0050 |
| 6 | 闫益波,杜丽英,张伯池,等.山西太行黑山羊mtDNA D-Loop区遗传多样性分析[J].山西农业科学,2020,48(6):974-980. |
| YANY B,DUL Y,ZHANGB C,et al.Genetic diversity analysis of mtDNA D-Loop region in Shanxi Taihang black goat[J].Journal of Shanxi Agricultural Sciences,2020,48(6):974-980. | |
| 7 | DOTSEVA V,KUNZE,KHARZINOVAV R,et al.Mitochondrial DNA analysis clarifies taxonomic status of the northernmost snow sheep (Ovis nivicola) population[J].Life (Basel),2021,11(3):252. |
| 8 | 常晨城,白音巴图,周乐,等.内蒙古地方绵羊遗传多样性及尾椎数性状相关选择信号研究[J].中国畜牧杂志,2023,59(12):109-115. |
| CHANGC C,BAIY B T,ZHOUL,et al.Genetic diversity and selection signals associated with tail vertebrae number trait in local sheep in Inner Mongolia[J].Chinese Journal of Animal Science,2023,59(12):109-115. | |
| 9 |
SHERIFFO,AHBARAA M,HAILEA,et al.Whole-genome resequencing reveals genomic variation and dynamics in Ethiopian indigenous goats[J].Front Genet,2024,15,1353026.
doi: 10.3389/fgene.2024.1353026 |
| 10 | 周东辉,张昌政,张任豹,等.基于70K SNP芯片评估牙山黑绒山羊保种群体的遗传结构[J].中国畜牧杂志,2024,60(4):116-122. |
| ZHOUD H,ZHANGC Z,ZHANGR B,et al.Assessment of the genetic structure of the Yashan black cashmere goat conservation population based on 70K SNP microarrays[J].Chinese Journal of Animal Science,2024,60(4):116-122. | |
| 11 |
MEYERMANSR,GORSSENW,WIJNROCXK,et al.Unraveling the genetic diversity of Belgian Milk Sheep using medium-density SNP genotypes[J].Anim Genet,2020,51(2):258-265.
doi: 10.1111/age.12891 |
| 12 |
ZHOUM L,WANGG F,CHENM H,et al.Genetic diversity and population structure of sheep (Ovis aries) in Sichuan, China[J].PLoS One,2021,16(9):e0257974.
doi: 10.1371/journal.pone.0257974 |
| 13 |
马克岩,韩金涛,白雅琴,等.基于简化基因组测序的永登七山羊遗传多样性分析[J].畜牧兽医学报,2023,54(5):1939-1950.
doi: 10.11843/j.issn.0366-6964.2023.05.016 |
|
MAK Y,HANJ T,BAIY Q,et al.Genetic diversity analysis of Yongdeng Qishan sheep based on specific-locus amplified fragment sequencing[J].Acta Veterinaria et Zootechnica Sinica,2023,54(5):1939-1950.
doi: 10.11843/j.issn.0366-6964.2023.05.016 |
|
| 14 |
MAK Y,LID P,QIX C,et al.Population structure, runs of homozygosity analysis and construction of single nucleotide polymorphism fingerprinting database of Longnan goat population[J].Food Energy Secur,2024,13(1):e517.
doi: 10.1002/fes3.517 |
| 15 |
LIH,DURBINR.Fast and accurate short read alignment with Burrows-Wheeler transform[J].Bioinformatics,2009,25(14):1754-1760.
doi: 10.1093/bioinformatics/btp324 |
| 16 |
MCKENNAA,HANNAM,BANKSE,et al.The Genome Analysis Toolkit: a Mapreduce framework for analyzing next-generation DNA sequencing data[J].Genome Res,2010,20(9):1297-1303.
doi: 10.1101/gr.107524.110 |
| 17 |
LIH,HANDSAKERB,WYSOKERA,et al.The sequence alignment/map format and SAMtools[J].Bioinformatics,2009,25(16):2078-2079.
doi: 10.1093/bioinformatics/btp352 |
| 18 |
CINGOLANIP,PLATTSA,WANGL L,et al.A program for annotating and predicting the effects of single nucleotide polymorphisms, SnpEff[J].Fly (Austin),2012,6(2):80-92.
doi: 10.4161/fly.19695 |
| 19 |
PRICEA L,PATTERSONN J,PLENGER M,et al.Principal components analysis corrects for stratification in genome-wide association studies[J].Nat Genet,2006,38(8):904-909.
doi: 10.1038/ng1847 |
| 20 |
KUMARS,STECHERG,LIM,et al.MEGA X: molecular evolutionary genetics analysis across computing platforms[J].Mol Biol Evol,2018,35(6):1547-1549.
doi: 10.1093/molbev/msy096 |
| 21 | ALEXANDERD H,NOVEMBREJ,LANGEK.Fast model-based estimation of ancestry in unrelated individuals[J].Genome Res,2009,19(9):1655-1664. |
| 22 | YANGJ,LEES H,GODDARDM E,et al.GCTA: a tool for genome-wide complex trait analysis[J].Am J Hum Genet,2011,88(1):76-82. |
| 23 | REEDD H,FRANKHAMR.Correlation between fitness and genetic diversity[J].Conserv Biol,2003,17(1):230-237. |
| 24 | 孙学良. 川中黑山羊遗传多样性和毛色性状的全基因组关联分析[D]. 成都: 四川农业大学, 2023. |
| SUN X L. Genetic diversity and genome-wide association study of coat color in Chuanzhong black goats[D]. Chengdu: Sichuan Agricultural University, 2023. (in Chinese) | |
| 25 |
张任豹,周东辉,周李生,等.基于70 K SNP芯片分析济宁青山羊保种群体的遗传结构[J].畜牧兽医学报,2023,54(7):2836-2847.
doi: 10.11843/j.issn.0366-6964.2023.07.016 |
|
ZHANGR B,ZHOUD H,ZHOUL S,et al.Analysis of genetic structure of conservation population in Jining gray goats based on 70 K SNP chip[J].Acta Veterinaria et Zootechnica Sinica,2023,54(7):2836-2847.
doi: 10.11843/j.issn.0366-6964.2023.07.016 |
|
| 26 | 余姣姣,刘家斌,徐永涛,等.成都麻羊种群微卫星标记遗传多样性评估[J].四川林业科技,2021,42(1):130-136. |
| YUJ J,LIUJ B,XUY T,et al.Genetic diversity assessment of Chengdu gray goat based on microsatellite markers[J].Journal of Sichuan Forestry Science and Technology,2021,42(1):130-136. | |
| 27 | 李亚明. 内蒙古绒山羊种群遗传多样性分析及种质资源鉴定[D]. 呼和浩特: 内蒙古农业大学, 2023. |
| LI Y M. Analysis of genetic diversity and identification of germplasm resources of Inner Mongolia cashmere goats populations[D]. Hohhot: Inner Mongolia Agricultural University, 2023. (in Chinese) | |
| 28 | 许丽梅. 10个山羊群体遗传多样性的微卫星分析[D]. 兰州: 甘肃农业大学, 2010. |
| XU L M. Genetic diversity in 10 goat breeds based on microsatellite analysis[D]. Lanzhou: Gansu Agricultural University, 2010. (in Chinese) | |
| 29 | WANGY,DONGR L,LIX,et al.Analysis of the genetic diversity and family structure of the Licha black pig population on Jiaodong peninsula, Shandong Province, China[J].Animals (Basel),2022,12(8):1045. |
| 30 | WRIGHTS.Variability within and among natural populations[M].Chicago:University of Chicago Press,1984,41-579. |
| 31 | PETERB M.Admixture, population structure, and F-statistics[J].Genetics,2016,202(4):1485-1501. |
| 32 | MACHOVÁK,MARINAH,ARRANZJ J,et al.Genetic diversity of two native sheep breeds by genome-wide analysis of single nucleotide polymorphisms[J].Animal,2023,17(1):100690. |
| 33 | O'BRIENA C,PURFIELDD C,JUDGEM M,et al.Population structure and breed composition prediction in a multi-breed sheep population using genome-wide single nucleotide polymorphism genotypes[J].Animal,2020,14(3):464-474. |
| 34 | WANGJ,CHENY L,WANGX L,et al.The genetic diversity of seven indigenous Chinese goat breeds[J].Small Ruminant Res,2008,74(1-3):231-237. |
| 35 | ZORCM,ŠKORPUTD,GVOZDANOVIĆK,et al.Genetic diversity and population structure of six autochthonous pig breeds from Croatia, Serbia, and Slovenia[J].Genet Sel Evol,2022,54(1):30. |
| 36 |
苟想珍,杨军祥,赵子惠,等.基于简化基因组测序(Super-GBS)的子午岭黑山羊保种群遗传结构评估[J].畜牧兽医学报,2024,55(10):4334-4345.
doi: 10.11843/j.issn.0366-6964.2024.10.009 |
|
GOUX Z,YANGJ X,ZHAOZ H,et al.Evaluation of the population structure of the Ziwuling black goat based on super-GBS[J].Acta Veterinaria et Zootechnica Sinica,2024,55(10):4334-4345.
doi: 10.11843/j.issn.0366-6964.2024.10.009 |
|
| 37 | KAPLIP,YANGZ H,TELFORDM J.Phylogenetic tree building in the genomic age[J].Nat Rev Genet,2020,21(7):428-444. |
| 38 | TANGH,PENGJ,WANGP,et al.Estimation of individual admixture: analytical and study design considerations[J].Genet Epidemiol,2005,28(4):289-301. |
| 39 | 何亮宏,李昱姗,邓占钊,等.利用全基因组测序技术鉴定宁夏彭阳县利木赞牛的群体遗传结构[J].中国牛业科学,2024,50(4):1-5. |
| HEL H,LIY S,DENGZ Z,et al.Population genetic structure analysis of Limousin cattle in Pengyang County, Ningxia through whole genome sequencing[J].China Cattle Science,2024,50(4):1-5. | |
| 40 | 徐媛,徐继平,刘小英,等.基于全基因组重测序的现代马群体遗传结构和选择信号分析[J].畜牧兽医杂志,2024,43(5):1-7, 23. |
| XUY,XUJ P,LIUX Y,et al.Modern horse population genetic structure and selection signal analysis based on whole-genome sequencing[J].Journal of Animal Science and Veterinary Medicine,2024,43(5):1-7, 23. |
| [1] | HU Xin, YOU Wei, JIANG Fugui, CHENG Haijian, SUN Zhigang, SONG Enliang. Analysis of Genetic Diversity and Population Structure of Simmental Cattle Based on Whole Genome Resequencing [J]. Acta Veterinaria et Zootechnica Sinica, 2025, 56(3): 1189-1202. |
| [2] | Siyu LIU, Man ZHANG, Yan ZHANG, Zhitong WEI, Xinglei QI, Tengyun GAO, Xian LIU, Dong LIANG, Tong FU. Evaluation of the Conservation Effect in Nanyang Cattle Based on Resequencing Data [J]. Acta Veterinaria et Zootechnica Sinica, 2024, 55(9): 3876-3886. |
| [3] | Hongyan HUANG, Liyun ZHANG, Zhirong HUANG, Zhongping WU, Xumeng ZHANG, Hongjia OUYANG, Junpeng CHEN, Zhenping LIN, Yunbo TIAN, Xiujin LI, Yunmao HUANG. The Study on Population Genetic Diversity and Genome-wide Association Study of Body Weight and Size Traits for Lion-head Geese [J]. Acta Veterinaria et Zootechnica Sinica, 2024, 55(9): 3914-3924. |
| [4] | Ting WANG, Yuanqing ZHANG, Yibo YAN, Mingjun SHANGGUAN, Hongyu GUO, Zhiwu WANG. The Genetic Structure Analysis and the Comparative Analysis of Selection Signals in 'Tezanghan' Sheep [J]. Acta Veterinaria et Zootechnica Sinica, 2024, 55(7): 2913-2926. |
| [5] | TU Yun, ZENG Yanan, ZHANG Zhenghao, HONG Rui, WANG Zhen, WU Ping, ZHOU Zeyang, YE Yiru, DU Yanan, ZUO Fuyuan, ZHANG Gongwei. Genetic Structure and Runs of Homozygosity Analysis of Fuling Buffalo and Southwest Buffalo Breeds [J]. Acta Veterinaria et Zootechnica Sinica, 2024, 55(5): 1989-1998. |
| [6] | SONG Kelin, YAN Zunqiang, WANG Pengfei, CHENG Wenhao, LI Jie, BAI Yaqin, SUN Guohu, GUN Shuangbao. Analysis on Genetic Diversity and Genetic Structure Based on SNP Chips of Huixian Qingni Black Pig [J]. Acta Veterinaria et Zootechnica Sinica, 2024, 55(3): 995-1006. |
| [7] | CHENG Xinyan, WANG Shiyuan, JI Yebiao, HUANG Sixiu, YANG Jie, MENG Fanming, ZHANG Mao, CAI Gengyuan, LIU Langqing. Evaluation of the Genetic Structure of Conservation Populations of Four Major Local Pig Breeds in Guangdong Province Based on a 50K SNP Chip [J]. Acta Veterinaria et Zootechnica Sinica, 2024, 55(12): 5464-5477. |
| [8] | XU Kuowei, LI Zhuohui, LENG Tangjian, XIONG Bao, ZHOU Jielong, GUO Panjiang, WANG Yu, CHEN Fenfen. Analysis of Population Genetic Diversity and Population Genetic Structure of Conservation Population in Ninglang Plateau Chickens Based on Whole-genome Resequencing SNP [J]. Acta Veterinaria et Zootechnica Sinica, 2024, 55(12): 5498-5510. |
| [9] | Xiangzhen GOU, Junxiang YANG, Zihui ZHAO, Lingxia FENG, Wanhui CHEN, Yujie LI, Zhongyu ZHANG, Keyan MA, Dongping JIANG, Rong CHANG, Yazhou WEN, Ke WANG, Youji MA. Evaluation of the Population Structure of the Ziwuling Black Goat Based on Super-GBS [J]. Acta Veterinaria et Zootechnica Sinica, 2024, 55(10): 4334-4345. |
| [10] | YANG Qing, GONG Jing, ZHAO Xueyan, ZHU Xiaodong, GENG Liying, ZHANG Chuansheng, WANG Jiying. Comparison of Array and Resequencing in Pig Genetic Structure Studies [J]. Acta Veterinaria et Zootechnica Sinica, 2023, 54(7): 2772-2782. |
| [11] | ZHANG Renbao, ZHOU Donghui, ZHOU Lisheng, GAO Xiaoxiao, LIU Nan, HE Jianning. Analysis of Genetic Structure of Conservation Population in Jining Gray Goats Based on 70 K SNP Chip [J]. Acta Veterinaria et Zootechnica Sinica, 2023, 54(7): 2836-2847. |
| [12] | ZHAO Zhenjian, WANG Shujie, CHEN Dong, JI Xiang, SHEN Qi, YU Yang, CUI Shengdi, WANG Junge, CHEN Ziyang, TANG Guoqing. Population Structure and Genetic Diversity Analysis of Neijiang Pigs Based on Low-coverage Whole Genome Sequencing [J]. Acta Veterinaria et Zootechnica Sinica, 2023, 54(6): 2297-2307. |
| [13] | TAO Xuan, YANG Xuemei, LIANG Yan, LIU Yihui, WANG Yong, KONG Fanjing, LEI Yunfeng, YANG Yuekui, WANG Yan, AN Rui, YANG Kun, Lü Xuebin, HE Zhiping, GU Yiren. Analysis of Genetic Structure of Conservation Population in Yacha Pig Based on SNP Chip [J]. Acta Veterinaria et Zootechnica Sinica, 2023, 54(6): 2308-2319. |
| [14] | LIU Shuang, HE Lixia, MA Jun, FENG Xue, YANG Mengli, WANG Shuzhe, YANG Runjun, FANG Xibi, XIAN Hailong, WANG Yongkang, ZHANG Lupei, MA Yun. Analysis on Genetic Background and Body Size Indexes and Beef-purpose Index of Guyuan Cattle [J]. Acta Veterinaria et Zootechnica Sinica, 2023, 54(6): 2376-2388. |
| [15] | YANG Sukun, DONG Yimeng, WANG Hongliang, ZHAO Xitang, CHEN Xu, XING Xiumei. Genetic Diversity Analysis of Stud Tahe Red Deer Based on the Gene Fragments of mtDNA and Y Chromosome [J]. Acta Veterinaria et Zootechnica Sinica, 2023, 54(6): 2402-2413. |
| Viewed | ||||||
|
Full text |
|
|||||
|
Abstract |
|
|||||